Get DiscoveredAppsAllDevices
Mastering Microsoft Intune Software Inventory: A Deep Dive into Automated Reporting
Managing a fleet of devices in a modern enterprise environment often feels like trying to herd cats—especially when it’s time to figure out exactly what software is installed where. If you’re an IT administrator using Microsoft Intune, you know that while the data exists within the portal, getting a clean, holistic, and shareable report can be a surprisingly manual task.
To bridge this gap, I developed a PowerShell-based reporting tool: the Intune Software Inventory Report. This script automates the extraction of discovered application data and transforms it into a professional, multi-sheet Excel workbook.
In this post, we’ll break down what the script does, how the underlying engine works, and why it’s a necessary addition to your IT toolkit. https://github.com/ckdalton01/Get-DiscoveredAppsAllDevices
What the Script Does
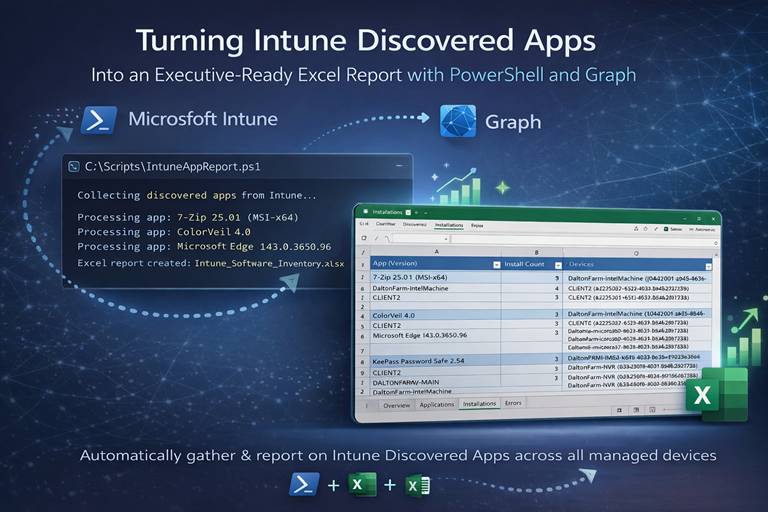
At its core, the script is a data bridge. It connects to the Microsoft Graph API, pulls every instance of a discovered app across your entire Intune tenant, and organizes that data into a format that humans (and managers) can actually read.
Rather than clicking through individual device records in the Intune console to see who has a specific version of a browser or a piece of legacy software, the script aggregates this information into two primary output files:
Intune_DiscoveredApps_WithDevices.csvIntune_Software_Inventory.xlsx
The Final Output Structure
The script doesn’t just dump a flat list—it categorizes the data into four distinct worksheets:
Overview - A high-level dashboard showing total discovered applications, installation records, and retrieval errors.
Applications - A summarized list of every unique application name and version found, along with installation counts.
Installations - A granular view that maps application names and versions to the specific devices where they are installed.
Errors - A dedicated log for any applications that encountered issues during the retrieval process, ensuring full transparency.
How It Works: Under the Hood
The script relies on two primary pillars: the Microsoft.Graph PowerShell SDK for data retrieval and the ImportExcel module for report generation.
1. Authentication and Permissions
Before the script can see your data, it must authenticate via Microsoft Graph. It requests specific, read-only permissions to adhere to the principle of least privilege:
DeviceManagementApps.Read.All
DeviceManagementManagedDevices.Read.All
2. The Data Collection Pipeline
The script performs a comprehensive sweep of the environment. It retrieves all discovered apps and their associated devices, streaming the raw data to a CSV file first to minimize the memory footprint on the local machine. This is particularly important for large environments where thousands of records might be processed.
3. Resiliency and Rate Limiting
One of the biggest challenges with the Graph API is throttling. If you send too many requests too quickly, the API will limit your connection. This script manages this through built-in retry logic and configurable delays:
$maxRetries  = 5
$baseDelayMs = 300
If a call fails, the script automatically retries up to five times with an exponential backoff, ensuring the reporting process is resilient even under heavy API load.
4. Excel Transformation
Once the data is collected, the script uses the ImportExcel module to build the final report. This includes professional touches such as frozen header rows, auto-sized columns, and wrapped text for multi-line content—making the data easy to navigate without manual formatting.
Why You Would Want to Use It
You might be wondering why to use a script instead of the built-in Intune reports. While Microsoft provides excellent tools, this automated approach offers several advantages for modern admins.
Version Proliferation Tracking
In a large environment, you rarely have just one version of an app. You might have several different versions of a browser or utility tool across your fleet. This script groups these by name and version, allowing you to see exactly where your update laggards are located.
Audit and Compliance Readiness
When auditors ask for a software inventory, they want a structured document. By generating a multi-sheet Excel workbook, you can provide a point-in-time snapshot of your environment’s software footprint that is ready for review or archival.
Error Visibility
Standard reporting can sometimes hide “missing” data. By including an Errors worksheet, this script tells you exactly which applications couldn’t be fully processed, allowing you to troubleshoot specific device or API issues rather than guessing why your numbers look off.
Getting Started
To run the script, ensure your environment meets the prerequisites and that you have the required modules installed.
Installation
# Install the necessary modules
Install-Module Microsoft.Graph -Scope CurrentUser
Install-Module ImportExcel -Scope CurrentUser

# Run the inventory script
.\Get-DiscoveredAppsAllDevices.ps1
The script can be found here: https://github.com/ckdalton01/Get-DiscoveredAppsAllDevices
Performance Considerations
For large environments with thousands of applications, the script may take over 30 minutes to complete. This is normal behavior—the script carefully manages API rate limits to ensure data integrity without triggering blocks.
Summary
In the world of modern management, data is only as good as your ability to analyze it. By moving your software inventory from the cloud into a structured, formatted Excel workbook, you gain the ability to filter, pivot, and share your device insights with ease.
Whether you’re preparing for a security audit or just cleaning up your environment, this script provides the visibility you need to make informed decisions.